KubeLB ships four Grafana dashboards covering the core components. These are provisioned from the kubelb-manager and kubelb-ccm Helm charts when grafana.dashboards.enabled=true.
KubeLB / Overview
High-level system health dashboard providing a single-pane view across all KubeLB components.
Key panels:
- Total LoadBalancer, Route, and Tenant counts
- Resource distribution across namespaces and topologies
- Error rate tracking and reconciliation success rates
- System-wide resource trends over time
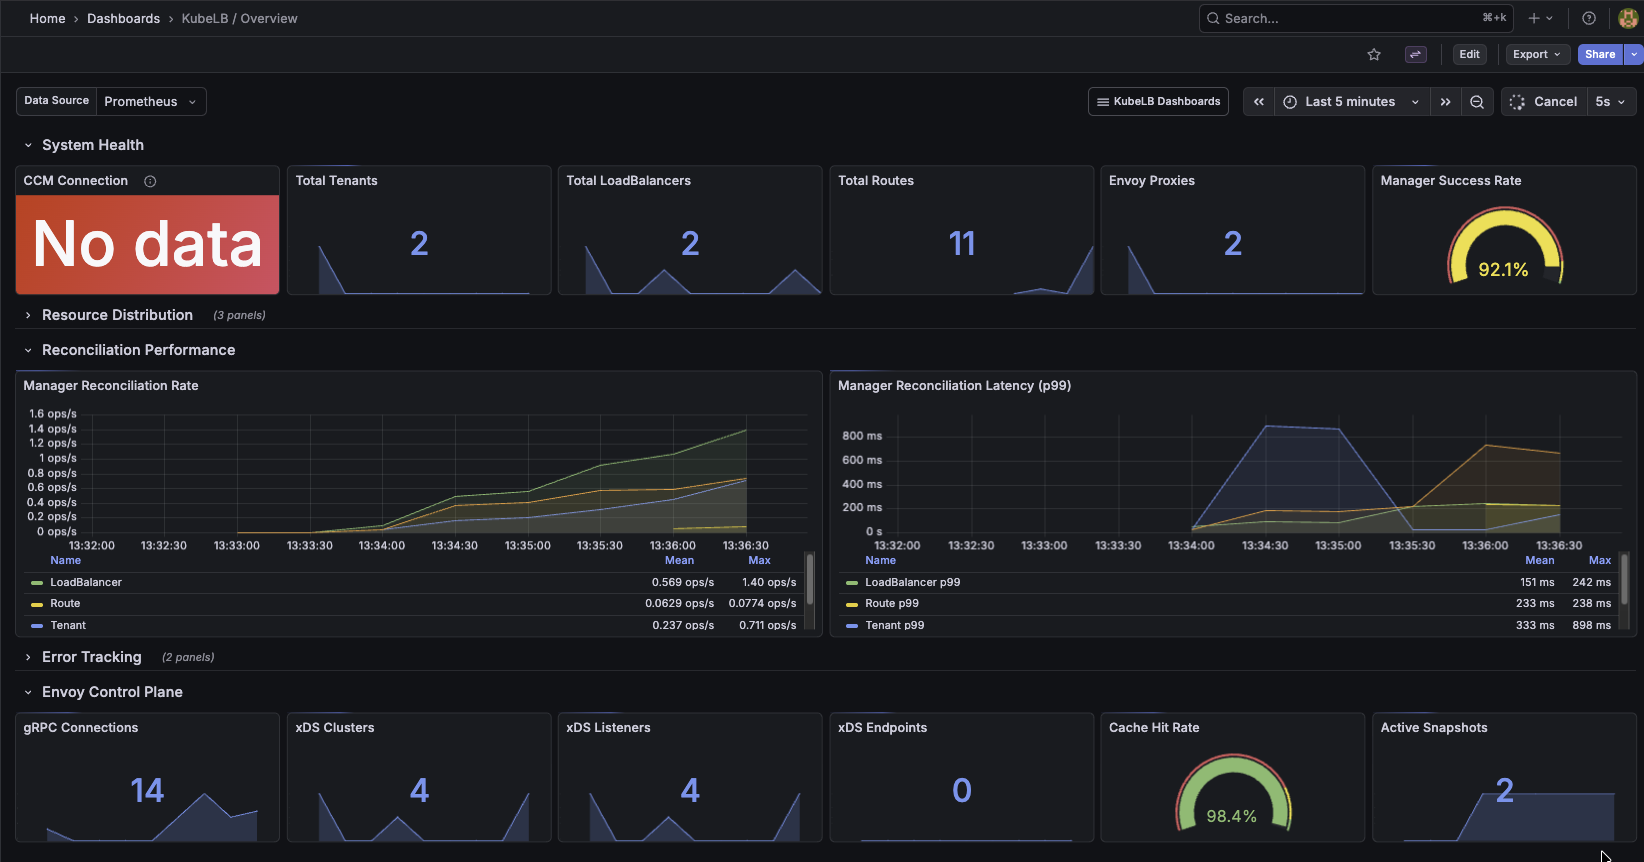
KubeLB Overview Dashboard
KubeLB / Manager
Detailed view of the KubeLB Manager component responsible for reconciling LoadBalancers, Routes, and Tenants.
Key panels:
- Resource inventory (LoadBalancers, Routes, Tenants, Envoy Proxies)
- Reconciliation rates and error counts by resource type
- Reconciliation latency histograms (p50, p95, p99)
- Port allocator utilization
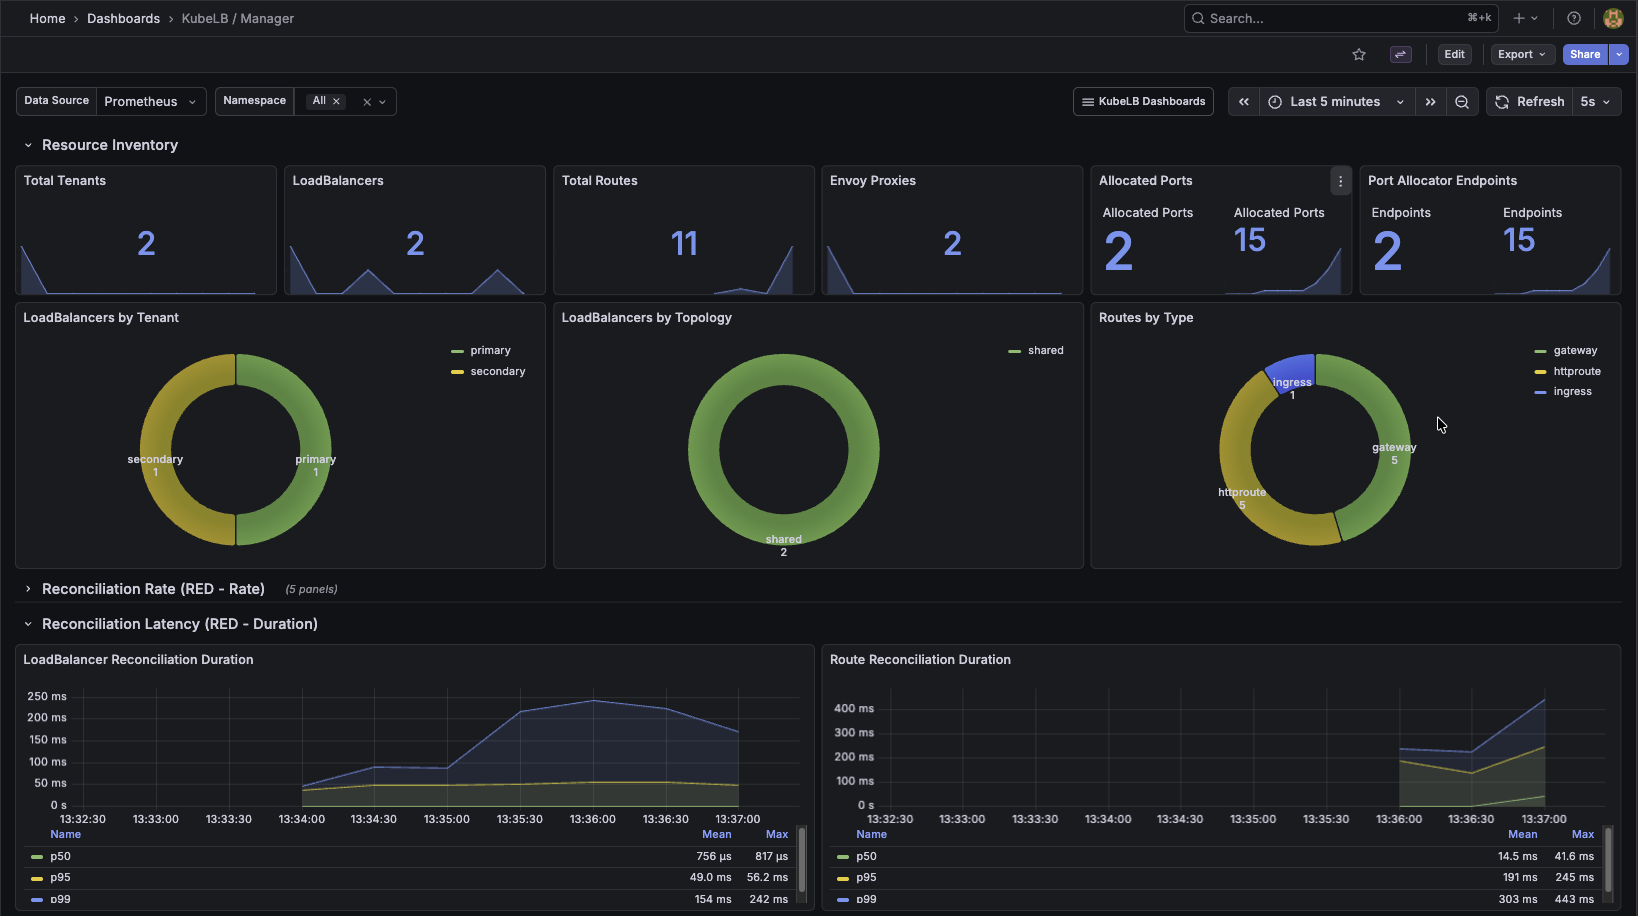
KubeLB Manager Dashboard
KubeLB / Envoy Control Plane
Monitors the xDS control plane that manages Envoy proxy configuration.
Key panels:
- xDS resource counts (clusters, endpoints, listeners, routes, secrets)
- gRPC connection count and request/response rates by type URL
- Snapshot generation duration and update frequency
- Cache hit/miss ratios
- Envoy proxy deployment lifecycle (creates/deletes)
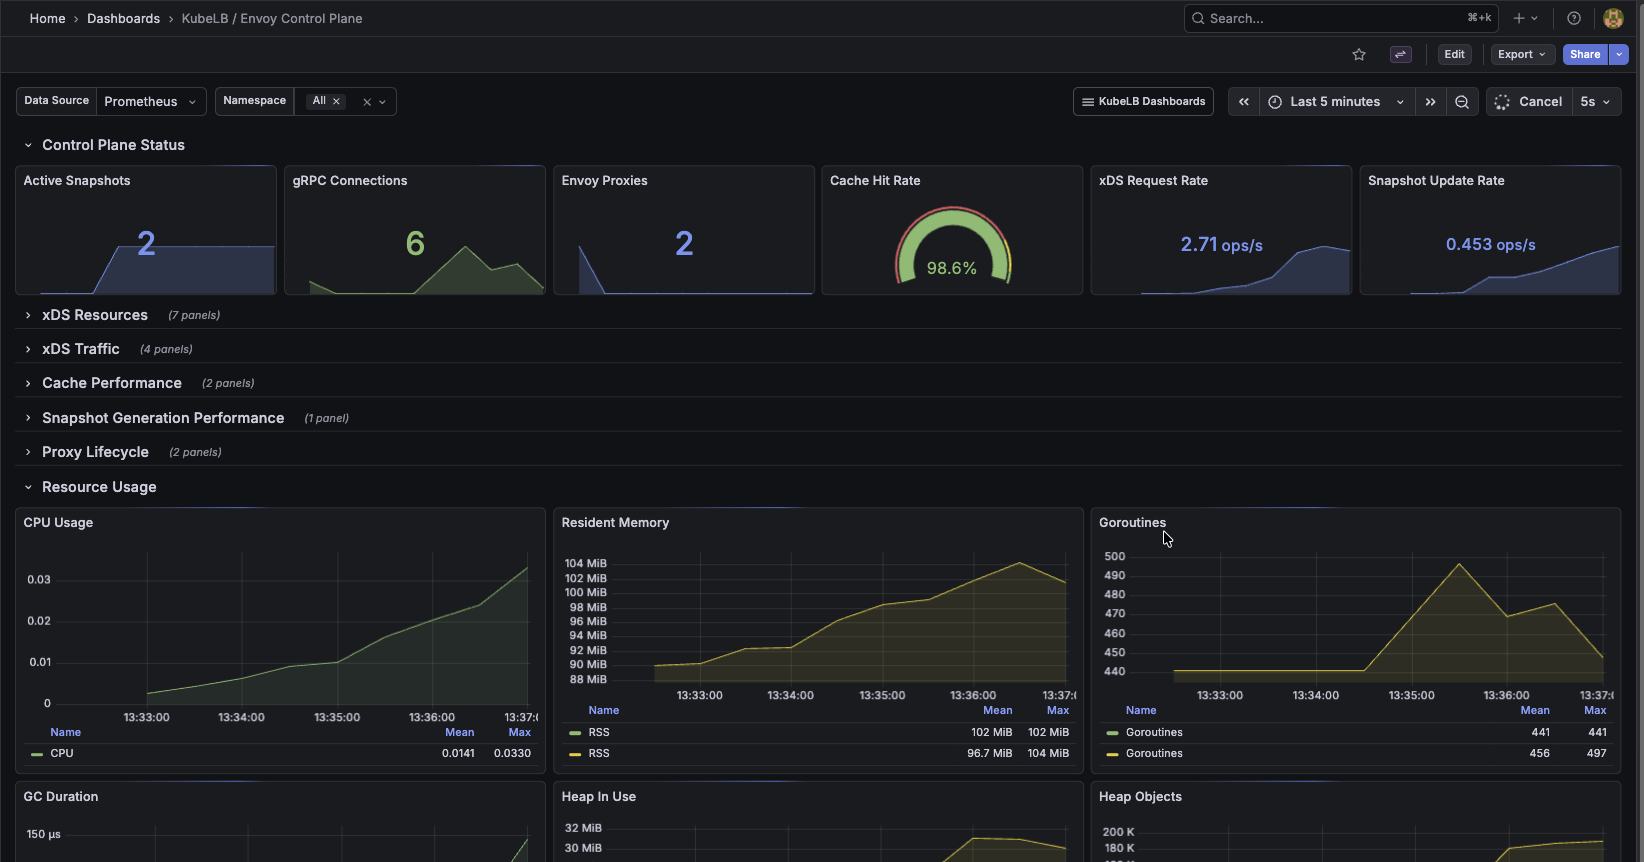
KubeLB Envoy Control Plane Dashboard
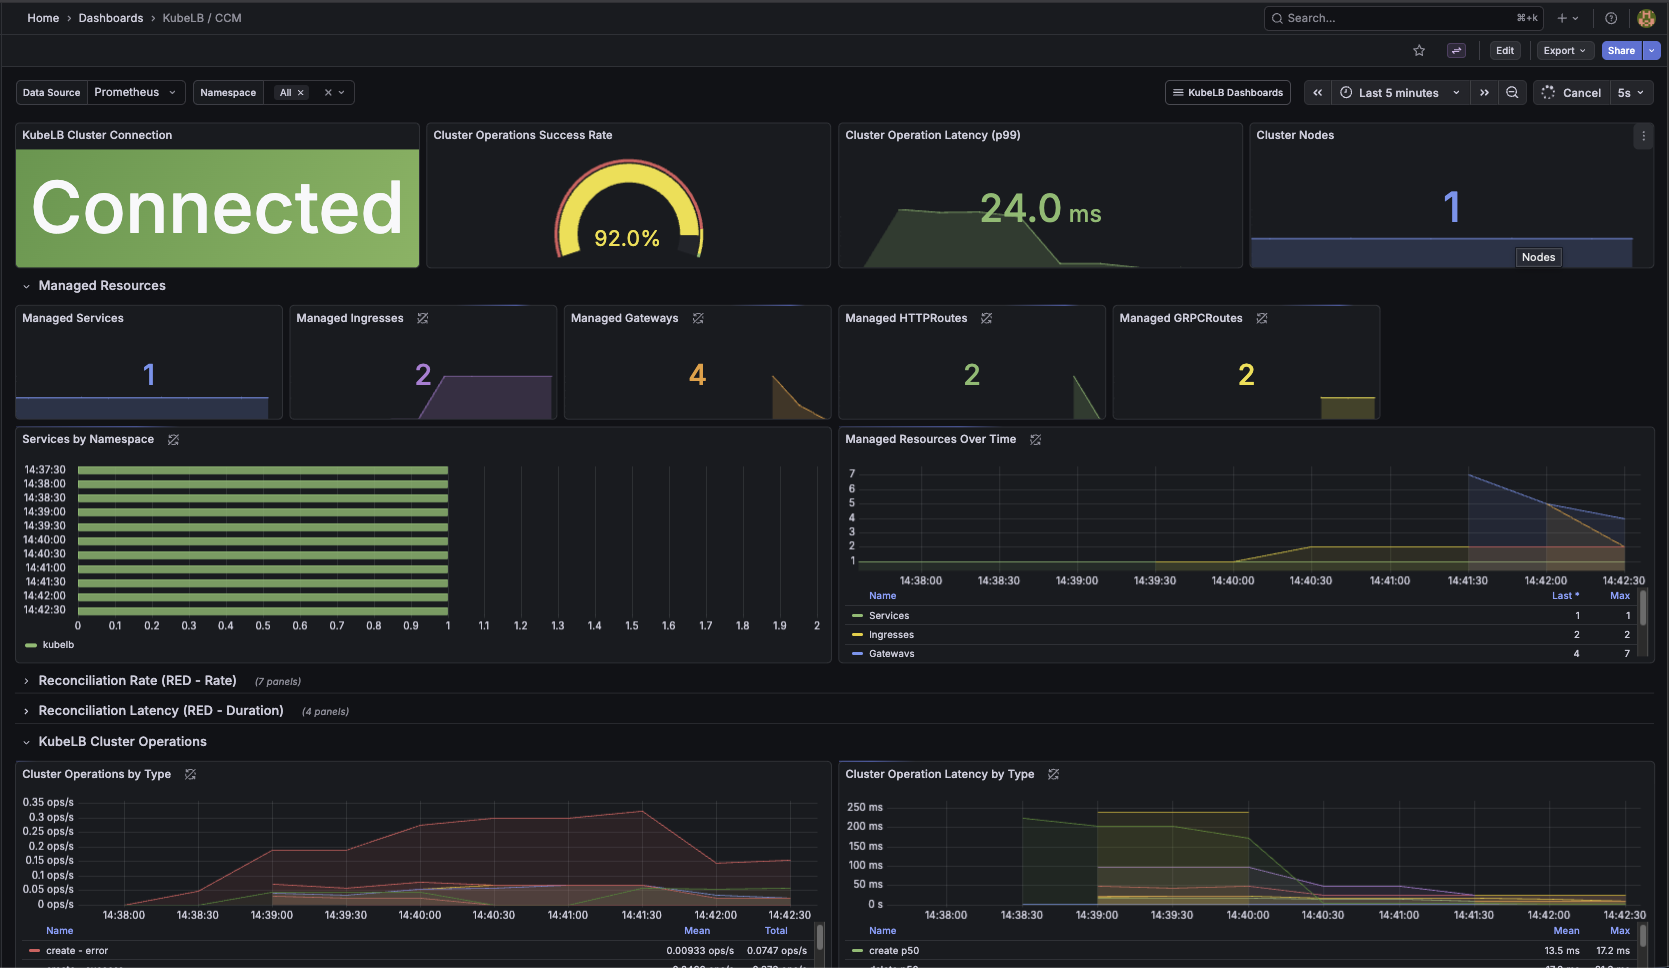
KubeLB / CCM
Monitors the Cloud Controller Manager running in tenant clusters.
Key panels:
- Managed resource counts (Services, Ingresses, Gateways, HTTPRoutes, GRPCRoutes)
- KubeLB cluster connection status and operation latency
- Reconciliation rates and error counts per resource type
- Node count and node reconciliation performance